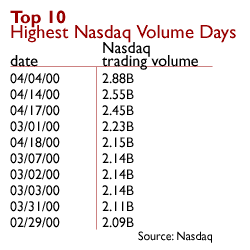
NEW YORK (CNNfn) - When the bull market was charging ahead earlier this year, nearly every week brought record high trading volume that generated windfalls for the brokers and banks that processed those trades.
Times have changed.
The 32 percent slide in the Nasdaq composite index since its March 10 high has kept investors out of the market and cut trading volumes dramatically. At the same time, weak demand for new stocks ground the initial public offering market to a near halt.
All this, analysts say, has cut business at brokers and investment banks.
How much of a revenue hit remains uncertain. But analysts say some consequences are inevitable.
"Obviously, it's going to have a negative impact on commission revenues," said Eva Radtke, brokerage analyst at Prudential Securities.
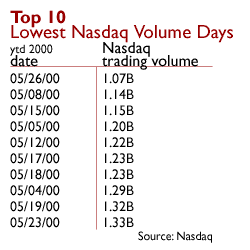
Ten of the Nasdaq stock market's slowest trading days of the year occurred in a three-week period between May 4 and May 26. During that time, volume averaged about half what it did in March.
 Investors wasted no time punishing companies that rely most on trading. Investors wasted no time punishing companies that rely most on trading.
Between May 4 and May 26, E*Trade (EGRP: Research, Estimates) stock fell about 25 percent while Ameritrade (AMTD: Research, Estimates) shed 26 percent, nearly twice the Nasdaq's composite's 14 percent slide in the time period.
Charles Schwab (SCH: Research, Estimates), which has more diverse business that include running mutual funds, shed 17 percent. Outfits that combine the broadest array of services from underwriting to advising on mergers and acquisitions held up the best. Merrill Lynch (MER: Research, Estimates) shed 8 percent and Lehman Brothers (LEH: Research, Estimates) tumbled 10 percent.
Greg Smith, who covers the online brokerage business for Chase H&Q, forecasts a 20 percent drop in online trading volume in the current quarter.
That's after volume jumped 56 percent in the last three months of 1999 and rose 67 percent in the first three months of this year.
"We're going to see a slowdown in revenues," said Smith
Still, Smith and others point out that volumes are still strong in year-over-year terms. He also expects the slowdown to be temporarily.
Goldman cut
Late last week, Merrill Lynch sharply slashed earnings estimates for Goldman Sachs. Citing several factors including trading volume, Merrill analyst Judah Kraushaar lowered estimates for the current quarter to between $1.30 per share and $1.35 per share from the $1.47 estimated by analysts. 
"Most of the company's revenue streams appear to have incrementally weakened each month in the quarter," Kraushaar wrote.
Since then, Wall Street has downwardly revised its consensus target to $1.39 per share, according to earnings tracker First Call.
The bear market has meant other slowdowns. Initial public offerings raised a mere $1.8 billion in May, according to Thomson Financial Securities Data. That's the worst month since January, 1999, and about a quarter of what was raised in May, 1999. For investment banks that underwrite these deals, this means getting less stock at the often lucrative offering price.
The road ahead
Despite the recent volume setback, most analysts expect the overall trend of steadily higher volumes to continue. After all, May's "low" volume, when a little more than one billion shares trade on the Nasdaq each day, still represents a big jump from the early 90s.
Still, the online brokers, Chase H&Q's Smith said, have already retreated from the aggressive advertising campaigns that marked the bull market.
Trading volumes, Prudential's Radtke said, "may actually get worse before they get better." 
|

