|
Amazon up on upbeat note
|
 |
July 14, 2000: 5:47 p.m. ET
Web retailing giant gets a green light from Salomon Smith Barney analyst
|
NEW YORK (CNNfn) - The beaten-down Web retailing giant Amazon.com soared Friday in response to positive comments from a Wall Street analyst, who predicted that its sales in the third and fourth quarters would be good and that it has enough cash on hand to survive.
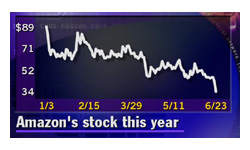
Amazon stock rose 7-1/2 to close at 42-1/2 Friday, a 21 percent gain, on volume that was three times its daily average. However, even after Friday's gain, Amazon (AMZN: Research, Estimates) is still down 62 percent from the high of 113 it reached late last year.
Amazon has been beaten down over the past several weeks because some analysts are alarmed by the rate at which it is bleeding cash and, thus, have concerns about its credit quality.
Amazon's sales zoomed to $1.64 billion last year from $148 million in 1997. However, its long-term debt grew to $1.47 billion from $77 million over the same period.
 In a scathing, 28-page report issued in late June, Lehman Brothers analyst Ravi Suria said that while Seattle-based Amazon has distinguished itself as one of the best-established brands in business-to-consumer electronic commerce, "from a bond perspective, we find the credit extremely weak and deteriorating." In a scathing, 28-page report issued in late June, Lehman Brothers analyst Ravi Suria said that while Seattle-based Amazon has distinguished itself as one of the best-established brands in business-to-consumer electronic commerce, "from a bond perspective, we find the credit extremely weak and deteriorating."
Citing what he called the company's high level of outstanding debt, negative cash flow and poor management of working capital, Suria said Amazon has become "extremely vulnerable" from a credit perspective.
"Going into an environment of increasing competition, expanding business segments and an expected jump in inventory, Amazon's cash flow situation is likely to worsen," he wrote in the report.
However, Salomon Smith Barney analyst Tim Albright defended the Web retailer in research notes issued Friday.
Albright said that he believes Amazon will end the March 2001 quarter with $666 million in cash and have $757 million in cash in March 2002, "a far cry from running out of money."
"Even when we stress test the model with slower inventory turns and faster payables turns, or with significantly lighter revenue, we still come out with more than $500 million in cash at the end of the March quarters in both 2001 and 2002," Albright said in his report.
A slower turnover of inventory causes companies to use up cash, since their cash becomes locked up in physical inventory. Likewise, when companies pay their bills faster, that also drains cash.
Albright estimates that Amazon's revenue will total $610 million in the quarter ended June 30 and that the company will post a loss of 32 cents per share for that period. He reiterated a "buy" on the stock. 
|
|
|
|
|
 |

|