|
Pay less for top returns
|
 |
July 26, 2000: 8:53 a.m. ET
Why pay a premium for a fund when you can get good value for less?
By Staff Writer Jeanne Sahadi
|
NEW YORK (CNNfn) - Sometimes owning a gold star mutual fund can be a little like belonging to a swank country club. It looks good on paper but membership dues can be high.
If you're paying a lot in annual fees, keep in mind the cost - or expense ratio - is shaved right off your return, robbing you of some much-desired bang for your buck, said Bill Dougherty, president of the investment adviser firm of Kanon Bloch Carre.
 Say your fund carries an expense ratio of 2.0 percent - or 200 basis points. That means annually you will pay $2.00 for every $100 you have in the fund. Say your fund carries an expense ratio of 2.0 percent - or 200 basis points. That means annually you will pay $2.00 for every $100 you have in the fund.
Unless the returns are two stratospheres above that of similar but cheaper funds, you may be getting a bum deal, experts say.
What's more, said Sheldon Jacobs, whose publication No-Load Fund Investor conducted a study examining fund costs, "Those funds with expense ratios over 2 percent over a five-year period are more than twice as likely to be in the bottom fifth of all funds."
What a good deal can mean
So rather than fork over a bundle for the privilege of being a shareholder, you might want to consider some funds that have offered consistently strong performance for less cost than many of their peers.
Of course, if you're a devout pupil of Vanguard founder John Bogle, you may be wedded to a handful of no-load index funds that offer rock-bottom fees and give you exposure to the broad market.
 But if you believe, as many do, that there is gold to be mined in active management, then you have some affordable and impressive options among load and no-load funds in the U.S. stock and international stock arenas. But if you believe, as many do, that there is gold to be mined in active management, then you have some affordable and impressive options among load and no-load funds in the U.S. stock and international stock arenas.
"Impressive" in this context means that a fund carries average or below-average risk levels and delivers returns that beat out the average performance of its peers over a three-year and five-year period (and often, a 10-year period as well).
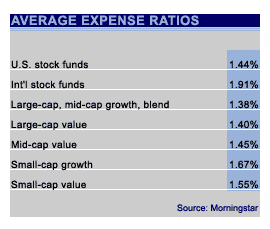
"Affordable" means an expense ratio that is most often less than the average of a fund's peers, and below 1 percent in many instances, far undercutting the 1.44 percent average for U.S. stock funds and the 1.91 percent average for international stock funds.
And, since most investors don't have tens of thousands of dollars lying around waiting for a purpose, most of the funds listed here have minimum investment requirements of $3,000 or less.
Shrinking universe
If you apply these criteria, you find the universe of 7,500 stock funds shrinks considerably, but you still are left with a body that hardly could be considered anorexic.
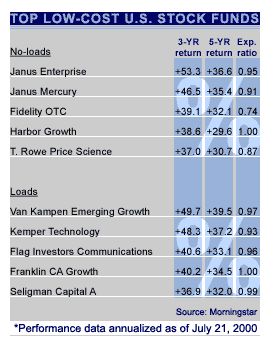
Big-name funds such as Janus Mercury, Fidelity OTC, Kemper Technology and Franklin CA Growth show up among the top performers for domestic stock funds.
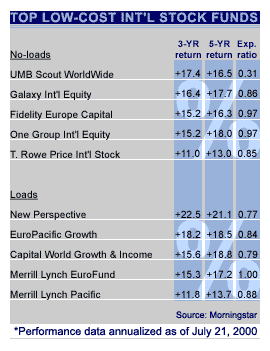
And among international funds, the best-performing fund in the 1990s, EuroPacific Growth, remains a strong, cost-effective candidate, as does T. Rowe Price International Stock.
Low-cost isn't everything
But judging by returns alone means a bias toward large-cap and mid-cap growth funds, which fared far better in the recent bull market than value and small-cap funds.
 That may not always be the case, and if you're looking for good bets in these categories to balance out your portfolio, certified financial planner Tom Grzymala suggests you consider funds with a 1.4 percent expense ratio or less since that is roughly the average expense for most large-cap and mid-cap value funds. That may not always be the case, and if you're looking for good bets in these categories to balance out your portfolio, certified financial planner Tom Grzymala suggests you consider funds with a 1.4 percent expense ratio or less since that is roughly the average expense for most large-cap and mid-cap value funds.
He would also consider higher expenses still for small-cap funds, which average about 1.6 percent in annual fees.
"Cost is a consideration but you've got a breadbasket of considerations," Grzymala said, among them manager tenure, risk, turnover rate (which can lead to high capital gains). And, if you're like him, you want a fund that ranks in the top 30 percent of its category in terms of annualized returns.
Dougherty would agree. If you're a long-term investor you want to invest in a� fund that charges reasonable expenses without subjecting you to unreasonable risk. "That's what investing is all about," he said.
For him, however, risk is not just about general volatility - since there can be upside volatility as well as downside volatility. He looks closely at how a fund plays in a down market. Janus Overseas, for instance, which generally gets the highest of marks from advisers and analysts, took a bigger hit during the Nasdaq's downturn this spring than the average international fund, he said.
As always, determining your risk tolerance - i.e., what you're willing to stomach -- is key to creating a successful portfolio.
When paying more may pay
And like risk, assessing what's "reasonable" in terms of cost can be subjective, too.
"I would try to get funds below the mean (but) ... I'll pay a little more to get a superior fund," Grzymala said.
 For his money, he would pay an extra 50 basis points above the average expense ratio if a fund offers substantial returns -- 10 percent or more -- above its peers. For his money, he would pay an extra 50 basis points above the average expense ratio if a fund offers substantial returns -- 10 percent or more -- above its peers.
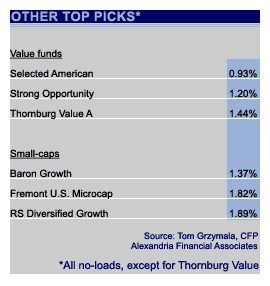
Take Fremont U.S. Microcap. While its expense ratio is above average, at 1.82 percent, its recent returns would make it a good bet, Grzymala said. (The fund is currently closed to new investors).
The fund has delivered a gain of 24 percent year to date in a down market when small-cap growth funds are averaging gains of about 3 percent, Grzymala said. On annualized basis, Fremont has delivered a 42.3 percent return over a three-year period and 41.21 percent over five years, putting it in the top 10 percent of its category.
But, he added, the fund should only account for a small portion of an individual's portfolio since it can be volatile - it returned a mere 2.9 percent in 1998 for instance, far below the 130 percent gain it rang up in 1999.
What might bring costs down
Having to comparison shop for the most cost-effective funds is a task that's not likely to disappear anytime soon, experts say. But your choices for low-cost investments are likely to grow as the fund industry comes under increasing pressure to reduce expenses.
The rise of no-load investing and index funds have certainly contributed to that pressure, as has the growth in the 401(k) market, which accounts for at least half of all new money going into funds, Dougherty said. Plan sponsors with large asset bases have leverage to get better deals for employees.
But Dougherty thinks pressure also may grow if the market becomes stingier with its returns and average investors get pickier about where they put their money.
"Costs are going to become more and more of a factor," Dougherty said. In the recent bull market, "to worry about costs was kind of anti-productive. But now, it's more difficult to make money," he added. "The pressure will become higher as returns go down." 
|
|
|
|
|
 |

|