graphic
News > Companies
PSINet beats estimates
August 8, 2000: 9:29 a.m. ET

ISP posts 2Q loss of $1.32 a share, edging forecasts by a penny
graphic
graphic graphic
graphic
NEW YORK (CNNfn) - Internet service provider PSINet posted a narrower-than-expected second-quarter loss Tuesday on a 125 percent revenue gain from the year-ago quarter.

Ashburn, Va.-based PSINet (PSIX: Research, Estimates) lost $215.6 million, or $1.32 per diluted share, compared with a loss of $62.4 million, or 51 cents per diluted share, a year earlier.

Analysts polled by First Call expected the company to lose $1.33 a share.
graphicRevenues jumped 125 percent to $248 million from $123.8 million. Web revenue grew 218 percent from the year-ago period and 59 percent from the first quarter 2000.

Excluding one-time items, the company lost $1.12 per share, compared with 51 cents per share a year ago.

The period from June 15 to June 30 includes contributions from PSINet Consulting Solutions, created when the PSINet acquired Metamor Worldwide Inc. for $1.98 billion. PSINet Consulting Solutions added $30.3 million in revenue, but also a $6.5 million loss.

"This quarter has been a turning point for PSINet," Larry Hyatt, executive vice president and CFO, said. "We have now completed our development form being simply an Internet access provider to a global Internet business solutions to companies, with a particular focus on complex managed Web hosting."

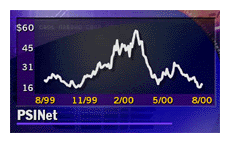
Shares of PSINet closed at 18-5/16, up 2-3/16 Monday. Back to top

  RELATED STORIES

PSINet scoops up ISPs - Sept. 20, 1999

  RELATED SITES

PSINet


Note: Pages will open in a new browser window
External sites are not endorsed by CNNmoney


graphic


Most stock quote data provided by BATS. Market indices are shown in real time, except for the DJIA, which is delayed by two minutes. All times are ET. Disclaimer. Morningstar: © 2018 Morningstar, Inc. All Rights Reserved. Factset: FactSet Research Systems Inc. 2018. All rights reserved. Chicago Mercantile Association: Certain market data is the property of Chicago Mercantile Exchange Inc. and its licensors. All rights reserved. Dow Jones: The Dow Jones branded indices are proprietary to and are calculated, distributed and marketed by DJI Opco, a subsidiary of S&P Dow Jones Indices LLC and have been licensed for use to S&P Opco, LLC and CNN. Standard & Poor's and S&P are registered trademarks of Standard & Poor's Financial Services LLC and Dow Jones is a registered trademark of Dow Jones Trademark Holdings LLC. All content of the Dow Jones branded indices © S&P Dow Jones Indices LLC 2018 and/or its affiliates.

Most stock quote data provided by BATS. Market indices are shown in real time, except for the DJIA, which is delayed by two minutes. All times are ET. Disclaimer. Morningstar: © 2018 Morningstar, Inc. All Rights Reserved. Factset: FactSet Research Systems Inc. 2018. All rights reserved. Chicago Mercantile Association: Certain market data is the property of Chicago Mercantile Exchange Inc. and its licensors. All rights reserved. Dow Jones: The Dow Jones branded indices are proprietary to and are calculated, distributed and marketed by DJI Opco, a subsidiary of S&P Dow Jones Indices LLC and have been licensed for use to S&P Opco, LLC and CNN. Standard & Poor's and S&P are registered trademarks of Standard & Poor's Financial Services LLC and Dow Jones is a registered trademark of Dow Jones Trademark Holdings LLC. All content of the Dow Jones branded indices © S&P Dow Jones Indices LLC 2018 and/or its affiliates.