|
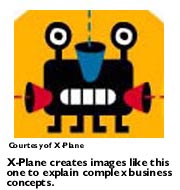
Illustrations draw investors
|
 |
August 10, 2000: 6:16 a.m. ET
Companies increasingly use illustrations to explain complex business plans
By Staff Writer Hope Hamashige
|
NEW YORK (CNNfn) - Can you explain what exactly it is your business does? Can you make your company's mission perfectly clear to anyone who asks?
That may sound like a ridiculous question, but explaining a company can be more difficult than you think. It can be particularly difficult for those people running cutting-edge high-technology companies to explain what exactly it is their company does in a way that other people understand the instant they say it.
One solution: stop talking and start drawing. More and more young  companies are including illustrations in their business plans as a visual tool to explain, in one snapshot, their company's products or services, who needs them, and how they will make money. companies are including illustrations in their business plans as a visual tool to explain, in one snapshot, their company's products or services, who needs them, and how they will make money.
No, we're not talking about pie charts that carve out a company's share of a market. We're talking about eye-catching illustrations that distill the essence of a company into a drawing in a way that makes the mission clear to anyone trying to make sense of a complex business plan.
Creating and communicating a clear vision can be critical to startups that are trying to sell potential employees and, perhaps more important, investors on their mission.
Robert Lessing, head of venture capital company Wit Capital, recently told an audience at a venture capital conference in New York that the business plans he reads now often include visual maps of the companies seeking venture capital financing.
One company profits by creating visual plans
One small company called XPlane Corp. -- a startup itself -- has grown dramatically in the last year, creating visual representations of companies for business plans, meetings and corporate presentations. According to the company's CEO, Ted Elsas, XPlane is succeeding on its ability to boil down complex business ideas into simple visual representations.
Originally founded as a visual arts company that created graphics for magazines and newspapers, St. Louis-based XPlane has grown tremendously in the past 10  months because of heavy demand for the company's work creating visual elements for business plans and other corporate presentations. months because of heavy demand for the company's work creating visual elements for business plans and other corporate presentations.
CEO Ted Elsas said XPlane still creates graphics for magazines like Business 2.0, but a growing part of XPlane's business is creating visual maps for companies, many of them new high technology businesses such as Digimarc and business-to-business company BuyPlastics.com.
"Information is exploding, but understanding isn't," Elsas said. "I think that's why were becoming so popular. What we do is to bridge the gap between what one party is trying to say and what the other understands."
XPlane's colorful, cartoonish illustrations have also caught the eye of several older, established names like Anheuser-Busch Co. (BUD: Research, Estimates) and Ralston-Purina Group (RAL: Research, Estimates). Big name consulting firms Andersen Consulting and Deloitte & Touche also recently signed XPlane on to create visual plans for their clients, many of which are high technology startups.
Sign of the times
As most venture capitalists will confess, anyone trying to capture their attention, and their money, has about a minute to get their point across. If you can do it in words, that's great. If a visual element can help you get your point made more quickly, that's even better.
"When people are confused they will find dozens of reasons to say no," Elsas said.
In pitching a business plan, venture capitalists will tell you to strive for simplicity.
"Simple and to the point is always the best way to get your point across," said Guy Kawasaki, CEO of Silicon Valley venture capital firm Garage.com. 
|
|
|
|
|
|
XPlane
|
Note: Pages will open in a new browser window
External sites are not endorsed by CNNmoney
|
|
|
|
 |

|

