|
U.S. trade gap hits record
|
 |
August 18, 2000: 10:59 a.m. ET
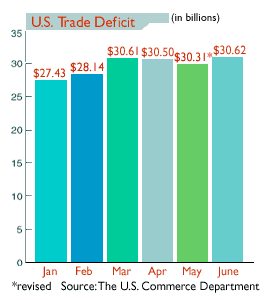
Deficit rises to $30.62B, driven by rising oil prices, but exports still strong
|
NEW YORK (CNNfn) - Rising oil prices drove the U.S. trade deficit to a record high of $30.62 billion in June, according to a government report Friday, although rising exports were also a sign of continued strength in the U.S. economy.
The gap, while rising, still came in lower than expected. A survey of analysts by Briefing.com forecast that the deficit would rise to $31.5 billion in the month, compared with the revised $30.31 billion level in May. The total gap edged past the previous record of $30.61 billion set in March.
 "The real surprise is the strength in exports," said Jay Bryson, global economist for First Union. "These sharp increases in computer-related exports corroborate recent U.S. industrial-production data that show marked strength in high-tech industries." "The real surprise is the strength in exports," said Jay Bryson, global economist for First Union. "These sharp increases in computer-related exports corroborate recent U.S. industrial-production data that show marked strength in high-tech industries."
Economic reports that have shown a slowing of the U.S. economy have been carefully watched as a sign the Federal Reserve will not raise interest rates at its meeting Tuesday.
Still, economists and investors felt that the Department of Commerce's June report showing a stronger-than-expected U.S. economy did little to change the expectation that the Fed will leave interest rates unchanged at the meeting. In the wake of the report, U.S. stock markets were mixed early Friday while bonds were little changed.
"Although the [Fed] likely will remain on hold next Tuesday, the ongoing strength of the U.S. economy, which today's data corroborate, may force it into action at a later date," said Bryson.
 Despite the widening trade gap, U.S. exports increased to $90.6 billion from $86.6 billion in May. Exports were helped by improved shipments of capital goods, primarily semiconductors and computer accessories, industrial supplies and materials as well as consumer goods. Despite the widening trade gap, U.S. exports increased to $90.6 billion from $86.6 billion in May. Exports were helped by improved shipments of capital goods, primarily semiconductors and computer accessories, industrial supplies and materials as well as consumer goods.
Imports increased to $121.2 billion from $116.9 billion in May, primarily due to an increase in the amount spent on crude oil. The average cost of a barrel of crude rose to $26.65 from $24.16 a barrel paid in May. That's the highest since the $29.51 paid in November 1990 in the wake of Iraq's invasion of Kuwait.
The amount of oil imported also increased to a record 300.9 million barrels from 297 million barrels in May.
The deficit with Canada, the United States' largest trading partner, edged up to $4.3 billion from a revised $3.7 billion in May. The deficit with Mexico, its second-largest partner, fell to $2.3 billion from $2.5 billion. The deficit with Western Europe also declined, to $4.3 from $5.7 billion in May. But the gap with China, with which the United States has the largest trade deficit, widened to $7.2 billion from $6.3 billion in May.
"Looking ahead, I don't foresee any dramatic improvement or worsening of the gap," Bill Cheney, chief economist John Hancock Financial Services, said. "On the whole, I think the more likely scenario is a very gradual narrowing. I do expect exports to increase, but waiting for allegedly healthier foreign economies to start buying American goods is getting to be like waiting for Godot, though there are hopeful signs in this report." 
|
|
|
|
|
 |

|