|
Make mutual fund magic
|
 |
September 28, 2000: 7:15 a.m. ET
Want to be a winner? Don't put money in the top-performing mutual funds
By Staff Writer Martine Costello
|
NEW YORK (CNNfn) - Remember the short kid in sixth grade who never got picked for softball in gym class because he struck out every time at bat? Five years later, he became a star hitter for the high school baseball team and went on to play in the major leagues.
Nobody likes to bet on a loser. Like those kids on the playing field who thought they had the winners all figured out, it's not easy to spot potential. The same is true for mutual funds. The worst performers this year could be long-term, home run winners that could make you rich.
 "People shouldn't chase returns," said Scott Kahan, a certified financial planner and president of Financial Asset Management Corp. in New York. "The average investor looks back at returns and buys based on performance. But people have to look at the worst-performing sectors, not the best-performing ones. That's where the smart investor goes." "People shouldn't chase returns," said Scott Kahan, a certified financial planner and president of Financial Asset Management Corp. in New York. "The average investor looks back at returns and buys based on performance. But people have to look at the worst-performing sectors, not the best-performing ones. That's where the smart investor goes."
Mirror, mirror on the wall...
Of course, it's not simply a matter of buying the dogs on the performance charts.
To begin with, managers are changing around their holdings at this time of the year by dumping losers and buying winners to make their funds look good -- a strategy called window dressing. Plus, funds issue capital gains distributions at the end of the year, so you need to be careful when you buy and sell shares.
 Rebalancing your portfolio is a delicate process in which you put your holdings under a microscope. Rebalancing your portfolio is a delicate process in which you put your holdings under a microscope.
You check their performance, look at your winners and losers, see what the market is doing and try to figure out if your asset allocation plan -- how you divvy your money between different types of stocks and bonds -- is out of whack.
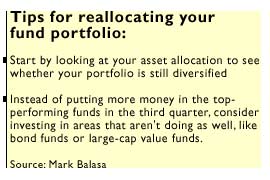
"By being diversified, you knock out the highs and the lows," said Mark Balasa, a certified financial planner and president of Balasa & Hoffman in Schaumberg, Ill.�
If one part of your portfolio is doing well, you might lighten up in that area and reallocate it to a struggling part of the market. That way, you'll stay diversified and stick to your allocation plan, he said.
 Do you need help with your portfolio? CNNfn.com's weekly Portfolio Rx feature looks at issues like asset allocation, rebalancing and diversification. Click here for the most recent article, and click here for help building your long-term strategy on CNNfn.com. Or, if you have a question about your nest egg, e-mail our experts at retirement@cnnfn.com Do you need help with your portfolio? CNNfn.com's weekly Portfolio Rx feature looks at issues like asset allocation, rebalancing and diversification. Click here for the most recent article, and click here for help building your long-term strategy on CNNfn.com. Or, if you have a question about your nest egg, e-mail our experts at retirement@cnnfn.com
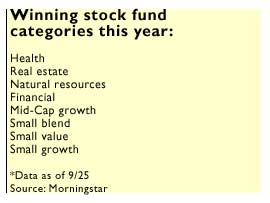
For example, instead of putting money into health funds, the top performers this year, consider large value, Balasa said. Health funds are up an average of 58.22 percent year to date as of Sept. 25, while large value funds are up 1.53 percent in the same time, according to Chicago-based fund tracker Morningstar.
Likewise, if you own financial funds -- which were strong performers in the third quarter with gains of 18.71 percent, putting them at the top of the list this year� -- you might divert some money into international funds, which have taken a beating all year, Kahan said.
 Virtually every category of international stock fund is down for the third quarter and for the year. At one end of the spectrum, international hybrid funds are down 2 percent, while funds that invest in the Pacific Rim are off 25.06 percent, according to Morningstar. Virtually every category of international stock fund is down for the third quarter and for the year. At one end of the spectrum, international hybrid funds are down 2 percent, while funds that invest in the Pacific Rim are off 25.06 percent, according to Morningstar.
"What happens is when something does well, people throw money at it," Kahan said. But even though Japan funds, for example, are having a terrible year, you still might want to consider the category, he said.
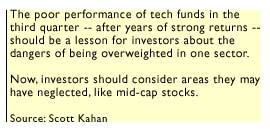
The flip side of the argument is that trouble in the technology sector should convince you that it's not smart to overweight your portfolio in one part of the market, Kahan said.
"People look at technology like it's a shining star, but it's no different than any other sector," Kahan said. "A few good years can really pull up the averages. But a few bad years can really pull down the averages."
Strong performance by small-cap and mid-cap stock funds are also a reminder that if you ignore certain broad sectors you could regret it, financial advisers say.�
"We're very interested in broad asset classes," Balasa said. "So many people's portfolios have gravitated toward large growth."
Click here to read CNNfn.com's recent special report on retirement planning, The Road to Riches.
Excluding volatile sector funds, the top performing asset classes this year are mid-cap growth funds, up 15.13 percent; small blend funds, up 10.95 percent, and small value, up 10.72 percent.
Large growth, by contrast, is up just 3.59 percent this year, Morningstar said.
"If I had no small caps, I'd want to have some," said Sheldon Jacob, editor of the investing newsletter No-Load Fund Investor. "If I had no value, I'd want to have some."
Capital gains and fall "cleaning"
So how do you get started? To shift around your portfolio, you can either sell shares of one fund in favor of another, or reinvest dividends from winning funds into different areas.
 Kahan recommends people rebalance twice a year, once at the beginning and once as it is coming to a close. Other financial pros will tell you to do it quarterly. Kahan recommends people rebalance twice a year, once at the beginning and once as it is coming to a close. Other financial pros will tell you to do it quarterly.
Keep in mind that this is a tricky time of year to be moving your portfolio around because of capital gains distributions.
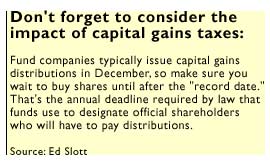
Typically, mutual fund companies issue capital gains distributions in December, mostly between Dec. 15 and Dec. 31. A distribution is mutual fund jargon for a dividend payment, short-term capital gains or long-term capital gains.
If you buy shares before the "record date," when fund companies designate official shareholders, you'll pay capital gains. By law, fund companies have to distribute 90 percent of their income by the date every year.
Under current law, you pay capital gains taxes of 20 percent on gains of assets you've held longer than a year. Short-term gains are taxed at income tax rates of up to 39.6 percent.
For example, let's say you bought 5,000 shares of a fund for $10 a share and the fund company tells you that you will have a distribution of 25 percent of the net asset value, Balasa said. You'll get a distribution of $12,500 of capital gains, so your tax tab at 20 percent is $2,500.
While some funds may have a distribution of 1 or 2 percent, there are cases of steeper ones, Balasa said.
For example, Warburg Pincus Japan Growth Fund in August paid shareholders short-term capital gains equal to about 22 percent of the NAV, according to Morningstar analyst Odyll Santos.
Other funds that are likely to have capital gains distributions are Fidelity Japan Smaller Company Fund, TCW Galileo Asia Pacific, and Fidelity Advisor Overseas, according to a recent review by Santos.
That's why it's so important to find out from your fund company when the record date will be - and whether there will be a distribution, said Jacob, of No-Load Fund Investor.
If you're selling a fund, you should sell before the distribution date, and if you're buying, you should buy afterwards.
Otherwise, you could buy a fund and pay capital gains even though you didn't get to benefit from the run-up. Likewise, your fund could be losing money and slap you with a distribution.
"The wild card is capital gains distributions," said Kahan. "So you have to be very careful when you're changing your portfolio." 
|
|
|
|
|
 |

|