|
U.S. industrial output slips
|
 |
November 15, 2000: 10:25 a.m. ET
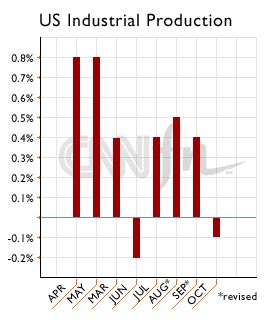
October rate shows slight decline; capacity utilization on target
|
NEW YORK (CNNfn) - Industrial production slipped in October, according to a government report released Wednesday, reversing gains in the two prior months and falling short of analysts' expectations of modest growth.
Output at the country's factories, mines and utilities fell 0.1 percent last month, compared with an upwardly revised 0.4 percent increase in September and a 0.5 percent gain in August, the Federal Reserve reported. The revised September figure was almost double the estimate that was originally reported last month; the August figure also was revised upward.
Analysts surveyed by Briefing.com had anticipated a 0.1 percent increase for October.
The decline was the first monthly production decrease since a 0.2 percent fall in July and only the second decline since early 1999.
Capacity use, which shows what percentage of their potential capacity� factories are using, came in at 82.1 percent, down from 82.5 percent in the prior month. The latest figure, the lowest operating rate since 82 percent in April, was in line with the Briefing.com forecast of 82 percent. The rate implies that there is no danger of production bottlenecks at plants and factories that could drive up prices.
Special Report: Eyes on the Fed
The data were released as Federal Reserve policymakers gathered to consider whether to alter interest rates. Most economists expect the Fed will leave rates unchanged, citing increasing signs of a slowdown in the economy.
Economist Richard Rippe, of Prudential Securities, said the industrial production numbers are another indicator that the economy is slowing � but not by much.
 While the October output figure was lower than expected, "You have to also notice that the two prior months were revised upward, and it looks to me as though the trend of increasing industrial output, albeit at a slower pace, is still intact," he said. While the October output figure was lower than expected, "You have to also notice that the two prior months were revised upward, and it looks to me as though the trend of increasing industrial output, albeit at a slower pace, is still intact," he said.
The Federal Reserve said the output of consumer goods slipped 0.4 percent last month, compared with a September gain. The production of durable consumer goods fell 2.5 percent, in large part because of a drop in the output of automotive products. The production of household appliances also showed significant declines.
However, non-durable consumer goods rose 0.2 percent, continuing a pattern of small gains recorded in recent months. Increases in the production of food and paper products offset declines in the output of clothing and consumer energy products. The Fed said unusually warm weather in October caused residential sales of electricity to drop and the production of consumer fuel to decline.
The output at utilities edged down almost 2 percent in October, while production at mines rose 0.7 percent, boosted by increases in coal mining and in oil and gas well drilling.
Meanwhile, in a separate report Wednesday, the Commerce Department said U.S. business inventories rose in September at the slowest pace in nearly two years, a signal that companies may be becoming more cautious in an environment in which the economy is slowing. Inventories rose a slim 0.1 percent in September to $1.207 trillion after a strong gain of 0.7 percent in August. 
-- from staff and wire reports
|
|
|
|
|
|
Federal Reserve
|
Note: Pages will open in a new browser window
External sites are not endorsed by CNNmoney
|
|
|
|
 |

|