|
U.S. manufacturing slows
|
 |
December 1, 2000: 11:22 a.m. ET
Purchasing managers' index slips again; construction activity increases
|
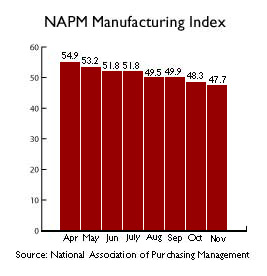
NEW YORK (CNNfn) - Activity at U.S. factories slowed for the fourth consecutive month in November, according to a survey of purchasing managers released Friday, providing further evidence that the economy continues to slow.
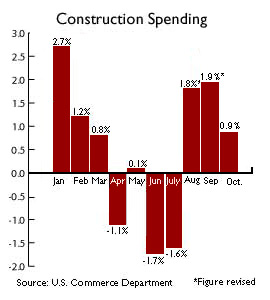
Separately, the Commerce Department reported that construction spending rose a healthy 0.9 percent to a seasonally adjusted annual rate of $825 million in October, fueled by private building projects. That compares with the Briefing.com consensus estimate of a 0.3 percent gain and a revised 1.9 percent jump in September.
The National Association of Purchasing Management reported that its manufacturing index slipped to a weaker-than-expected 47.7 percent in November from 48.3 percent in the prior month. The reading remains below 50 percent -- the level that points to growth in U.S. manufacturing. Analysts had anticipated the index would climb slightly to 48.5 percent.
 "The overall picture is one of continued softening in manufacturing activity during the month of November," said Norbert J. Ore, chairman of the NAPM's Manufacturing Business Survey Committee. "We continue to see few signs of encouragement in the near term for the manufacturing sector. "The overall picture is one of continued softening in manufacturing activity during the month of November," said Norbert J. Ore, chairman of the NAPM's Manufacturing Business Survey Committee. "We continue to see few signs of encouragement in the near term for the manufacturing sector.
The report is a closely monitored gauge of manufacturing activity. It is also one of the first indications of economic activity for November.
Several analysts said Friday that they were not surprised the index came in below their expectations, citing ominous clues from Thursday's regional Chicago manufacturing report. The Chicago region's PMI slipped to 41.7 in November, its lowest level since early 1991.
"The numbers [Friday] were slightly weaker than the original expectations, but after the Chicago PMI yesterday, traders were scaling back their expectations," Alan Ruskin, research director at 4Cast Inc., told Reuters. But, "it doesn't give the feel that the economy is falling off a cliff. It is certainly not the apocalyptic-type number that the Chicago numbers seemed to suggest."
The NAPM index's price component rose slightly from the prior month to 56.6 percent. The index measures the prices managers pay for raw materials.
Construction spending at healthy pace
Separately, the construction spending report showed strong building gains at factories and apartment units, which offset a big slide in spending on public highway projects.
 Private construction spending rose 1.4 percent to an annual rate of $639.2 billion. Gains were also recorded in funding for new housing units and multi-family units. Private construction spending rose 1.4 percent to an annual rate of $639.2 billion. Gains were also recorded in funding for new housing units and multi-family units.
Spending on public construction fell 0.9 percent to $185.8 billion, with declines seen on highways and streets, housing and redevelopment, hospitals and military facilities.
The reports were released at 10 a.m. ET. The Dow Jones industrial average rose about 85 points to 10,499 at 11 a.m. ET. The Nasdaq composite gained nearly 120 points to 2,716.
Wall Street also is looking at data Friday on November auto sales, which are forecast to be down from October's levels. 
-- from staff and wire reports
|
|
|
|
|
 |

|

