|
U.S. new home sales fall
|
 |
December 4, 2000: 10:58 a.m. ET
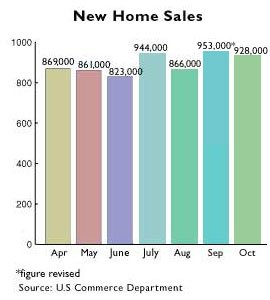
October home sales decline 2.6% to a 928,000-unit pace; still above forecasts
|
NEW YORK (CNNfn) - Sales of new homes across the United States slipped in October but still held close to the fastest pace in almost two years, the government reported Monday -- a sign that declining mortgage rates continue to lure buyers despite uncertainty about the economy and the stock market.
New home sales fell 2.6 percent to a 928,000-unit pace in October, above the 915,000 pace expected by economists polled by Briefing.com though below the revised 953,000-unit pace recorded in September. September's pace was the fastest since a rate of 995,000 in November 1998.
While stock market tumult and economic uncertainty have deterred consumers from purchasing big-ticket items in recent months, strong employment coupled with declining mortgage rates have continued to spur potential home buyers to sign on the dotted line.
"The renewed strength in home sales reflects lower mortgage rates; we expect rates to dip to a 14-month low this week," said Ian Shepherdson, chief U.S. economist with High Frequency Economics. "The housing rebound will ensure construction sector strength in the first quarter of 2001. No recession here."
Lower mortgage rates is one reason mortgage applications surged in October. The Mortgage Bankers Association's mortgage applications index rose as high as 356 in October and has since risen further, to 380.4 in the week ended Nov. 10. That was the highest in more than one year.
Not so expensive to borrow
And the average rate on a conventional 30-year mortgage has held below 8 percent since the middle of August. The rate was at a five-year high of 8.64 percent in May.
The reason for lower mortgage rates is rapidly declining yields in the government and corporate bond market. Banks typically borrow from financial markets to finance the loans they give out to homebuyers, profiting from the difference in yield between what they pay and what they charge.
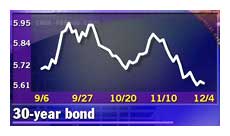 The yield on the most active 10-year note Monday fell 2 basis points to 5.48 percent, near its lowest level since May 1999. The 30-year bond's yield held steady at 5.63 percent. The yield on the most active 10-year note Monday fell 2 basis points to 5.48 percent, near its lowest level since May 1999. The 30-year bond's yield held steady at 5.63 percent.
The median price of a new home rose 2.9 percent in October to a record $174,900 from $169,900 in September. The supply of new homes for sale rose to 4.2 months' worth from 4 months' in September.
By region, sales decreased 8.2 percent in the Midwest to 156,000 units at an annual pace; 2.8 percent in the South to a 421,000-unit rate; and 8.9 percent in the West to an annual pace of 256,000 units. Sales rose 37.7 percent in the Northeast to 95,000 units at an annual rate.
Separately, the Conference Board said its index of leading economic indicators slipped 0.2 percent to 105.5 in October, slightly more than the 0.1 percent drop expected by economists and the unchanged reading registered in September. 
|
|
|
|
|
 |

|