graphic
News > Economy
U.S. factory orders fall
December 5, 2000: 1:18 p.m. ET

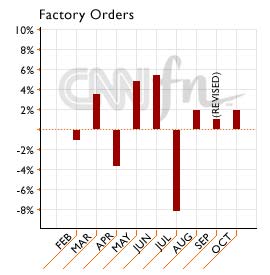
October orders decline 3.3%, a sharper drop than economists' forecasts
graphic
graphic graphic
graphic
NEW YORK (CNNfn) - Orders placed with U.S. manufacturers declined at a faster-than-expected pace in October, a government report released Tuesday showed, offering more statistical evidence that the U.S. economy is slowing down.


Click here for CNNfn.com's Special Report: Eyes on the Fed


The Commerce Department said factory orders fell 3.3 percent in October, a sharper decline that the 2.5 percent drop expected by economists polled by Briefing.com and well below September's revised 1.1 percent gain. September's orders initially were reported as a 1.6 percent increase.

It was the first decline in factory orders since an 8.1 percent slump in July.

graphic

Demand for durable goods fell 5.6 percent in October to $208.3 billion. The decline was also driven by a 16.1 percent drop in transportation equipment orders and a 9.9 percent drop in electronics orders, the government said.

Orders for aircraft and parts tumbled 44.9 percent in October after gaining 15.9 percent the previous month.

Excluding the more volatile transportation sector, factory orders in October fell 1.2 percent, the second decline in the last four months.

The report closely preceded comments by Federal Reserve Chairman Alan Greenspan that acknowledged signs of a softening economy. The remarks, at a banking conference in New York, appeared to make investors optimistic that the central bank could relax its position about inflation and interest rates in the near future.

-- from staff and wire reports
 graphic

  RELATED STORIES

Greenspan sees slowing - Dec. 5, 2000

Greenspan, Bush spur Wall St. rally - Dec. 5, 2000

  RELATED SITES

U.S. Commerce Department Manufacturing Report


Note: Pages will open in a new browser window
External sites are not endorsed by CNNmoney


graphic

Most stock quote data provided by BATS. Market indices are shown in real time, except for the DJIA, which is delayed by two minutes. All times are ET. Disclaimer. Morningstar: © 2018 Morningstar, Inc. All Rights Reserved. Factset: FactSet Research Systems Inc. 2018. All rights reserved. Chicago Mercantile Association: Certain market data is the property of Chicago Mercantile Exchange Inc. and its licensors. All rights reserved. Dow Jones: The Dow Jones branded indices are proprietary to and are calculated, distributed and marketed by DJI Opco, a subsidiary of S&P Dow Jones Indices LLC and have been licensed for use to S&P Opco, LLC and CNN. Standard & Poor's and S&P are registered trademarks of Standard & Poor's Financial Services LLC and Dow Jones is a registered trademark of Dow Jones Trademark Holdings LLC. All content of the Dow Jones branded indices © S&P Dow Jones Indices LLC 2018 and/or its affiliates.

Most stock quote data provided by BATS. Market indices are shown in real time, except for the DJIA, which is delayed by two minutes. All times are ET. Disclaimer. Morningstar: © 2018 Morningstar, Inc. All Rights Reserved. Factset: FactSet Research Systems Inc. 2018. All rights reserved. Chicago Mercantile Association: Certain market data is the property of Chicago Mercantile Exchange Inc. and its licensors. All rights reserved. Dow Jones: The Dow Jones branded indices are proprietary to and are calculated, distributed and marketed by DJI Opco, a subsidiary of S&P Dow Jones Indices LLC and have been licensed for use to S&P Opco, LLC and CNN. Standard & Poor's and S&P are registered trademarks of Standard & Poor's Financial Services LLC and Dow Jones is a registered trademark of Dow Jones Trademark Holdings LLC. All content of the Dow Jones branded indices © S&P Dow Jones Indices LLC 2018 and/or its affiliates.