|
U.S. trade gap narrows
|
 |
December 19, 2000: 10:53 a.m. ET
October report shows drop in import demand trimmed gap from record level
|
NEW YORK (CNNfn) - The U.S. appetite for overseas goods waned in October, leading to a narrowing of the nation's trade deficit from a record level the previous month, a government report showed Tuesday.
The Department of Commerce report showed the deficit fell to $33.18 billion. That's slightly above the level forecast by analysts surveyed by Briefing.com, which predicted a $33.0 billion gap. But other forecasts had put the deficit as high as $33.25 billion.
 The narrowing of the trade gap from September's revised figure of $33.74 billion appears to have been partly due to the slowing of the U.S. economy. Even though exports slipped from the September level, imports were down more, as purchases of overseas cars, industrial products and food fell in the period. The narrowing of the trade gap from September's revised figure of $33.74 billion appears to have been partly due to the slowing of the U.S. economy. Even though exports slipped from the September level, imports were down more, as purchases of overseas cars, industrial products and food fell in the period.
The trade deficit is a measure of the difference in the amount of money spent on imports versus exports, including both goods and services.
"With the U.S. slowdown looking more real each day, the trade deficit may have passed its peak," said Bill Cheney, chief economist for John Hancock Financial Services. "The slowdown hadn't hit full force yet in October. U.S. consumers are still sucking in massive amounts of imports. The slowdown will be more clearly seen in November and December's figures. If imported goods start to pile up on retailers' shelves this holiday season, imports could drop off fast."
Overall exports dropped to $91.2 billion from $92.7, while imports fell to $124.4 billion from $126.4 billion in September. However, the trade gap with major trading partners such as Canada, China, Japan and Western Europe all increased.
| |
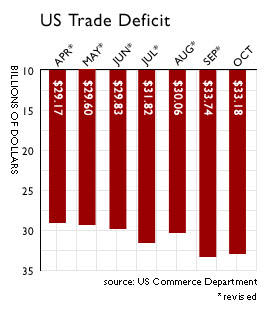
 U.S. TRADE DEFICIT NARROWS U.S. TRADE DEFICIT NARROWS
|
|
| |
|
A drop in U.S. appetite for imports helped narrow the nation's trade gap in October despite a fall in exports.
Overall deficit fell to $33.18 billion from September's record level of $33.74 billion.
October's imports dropped to $124.4 billion from $126.4 billion in September.
Exports slipped to $91.2 billion from $92.7 billion in September.
|
|
|
The average price paid for crude oil imports dropped slightly to $28.62 a barrel from the high of $28.98 a barrel paid in September, but an increase in consumption raised the overall cost of oil imports to $10.9 billion from $10.3 billion.
The imports of consumer goods also increased. But Jay Bryson, global economist with First Union, said that increase in consumers goods purchases from overseas suppliers was likely a buildup in inventory before what has become a relatively weak retail season.
The report was largely ignored by the markets, as trading in U.S. stock futures were little changed immediately after the release of the report at 8:30 a.m. ET. Markets were higher in morning trading after a slow start to the day.
Investors are eagerly awaiting a decision Tuesday afternoon from the Federal Reserve on the direction of short-term interest rates and the central bank's outlook for the U.S. economy. 
|
|
|
|
|
|
Department of Commerce
|
Note: Pages will open in a new browser window
External sites are not endorsed by CNNmoney
|
|
|
|
 |

|