|
Data sink Treasury
|
 |
January 12, 2001: 9:47 a.m. ET
Prices tumble after PPI, retail sales data raise inflation concerns
|
NEW YORK (CNNfn) - Treasury bonds fell in early trading Friday after key U.S. reports on producer prices and retail sales led to worries about inflation and questions about the future of Federal Reserve interest rate cuts.
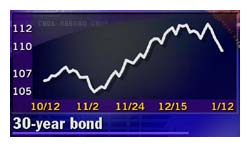 Shortly after 9:05 a.m. ET, benchmark 10-year notes fell 29/32 to 103-29/32, as their yield -- which moves inversely to price -- rising to 5.22 percent, while 30-year bonds dropped 31/32 to 109-9/32, yielding 5.60 percent. Shortly after 9:05 a.m. ET, benchmark 10-year notes fell 29/32 to 103-29/32, as their yield -- which moves inversely to price -- rising to 5.22 percent, while 30-year bonds dropped 31/32 to 109-9/32, yielding 5.60 percent.
Two-year Treasury notes were down 10/32 to 100-13/32, with their yield rising to 4.89 percent. Five-year notes were 21/32 lower at 103-13/32, yielding 4.95 percent.
Signs that U.S. stock markets were set to build on a long-delayed winning streak and a flood of new higher-yielding corporate debt which hit the market this week also pressured Treasurys.
Retail sales better than expected
But the government reports on producer prices and retail sales were the big news. The government said wholesale prices were unchanged in December, while retail sales rose 0.1 percent. Excluding food and energy, the "core" Producer Price Index rose 0.3 percent, above Wall Street forecasts.
The Fed holds its next scheduled policy meeting Jan. 30-31. Traders had hoped the retail sales report would show weakness in consumer spending, a key driver of U.S. economic growth, helping to convince the Fed to cut interest rates at the meeting.����
But the reports instead raised concerns about inflation, something the Fed could fend off by leaving rates alone.
In early trading, Nasdaq futures were up more than 25 points, a day after the composite index posted its first three-day rally in months. S&P futures were also up slightly.
Dollar builds strength
The economic data also helped the dollar against the euro and the yen in early trading.
 The euro fell to 94.80 cents after spending much of the week trading at or near six-month highs of 96 cents. The dollar rose against the yen, trading at 117.85 yen after rising at one point as high as 118.31, its highest level since July 1999. The euro fell to 94.80 cents after spending much of the week trading at or near six-month highs of 96 cents. The dollar rose against the yen, trading at 117.85 yen after rising at one point as high as 118.31, its highest level since July 1999.
The fall in Japan's Nikkei stock price index to 27-month lows Thursday has underlined the nation's economic woes, while comments from Japanese officials have suggested a laissez-faire attitude to the yen's weakness. 
- from staff and wire reports
* Disclaimer
|
|
|
|
|
|
BNamericas.com
|
Note: Pages will open in a new browser window
External sites are not endorsed by CNNmoney
|
|
|
|
 |

|