|
P&G edges past estimates
|
 |
January 30, 2001: 1:12 p.m. ET
Consumer goods maker says 2Q profit rose; comfortable with year forecast
|
NEW YORK (CNNfn) - Procter & Gamble Co., the No. 1 U.S. maker of household products, reported Tuesday that fiscal second-quarter earnings rose 4 percent, coming in a shade above Wall Street forecasts, and that it's comfortable with analyst forecasts for the current quarter and fiscal year.
The Cincinnati-based maker of Ivory soap, Pampers diapers and other products said it earned $1.3 billion, or 93 cents a diluted share, in its second quarter ended Dec. 31, up from $1.26 billion, or 88 cents a share, a year earlier. The results exclude restructuring charges.
Wall Street had been expecting profit of 92 cents a share excluding one-time items, according to First Call, which tracks analysts' estimates.
 Sales fell 4 percent to about $10.2 billion, the company said. Sales fell 4 percent to about $10.2 billion, the company said.
The company also said it's comfortable with analysts' per-share growth estimates for full-year core earnings and that it expects third-quarter earnings to fall between 72 cents and 74 cents a share -- about in line with Wall Street's forecast of 73 cents a share, according to First Call.
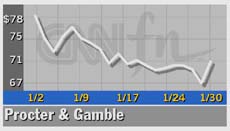
Procter & Gamble �(PG: Research, Estimates) shares, which have been cut in half from their 52-week high, jumped $3.05 to $69.90 in Tuesday afternoon trading.
"We delivered the earnings per share results we said we would for the second quarter in a row," CEO A.G. Lafley said. "Still, we can and must do better. Our goal is to get back to consistent annual double-digit EPS growth. Our choices to focus on big brands and leading customers, tighter cost and cash management, and better consumer value are providing a solid foundation for further progress."
Wall Street favors the company because of its abilities to meet expectations in the face of a weakening economy, especially after coming off a period of lower sales, Merrill Lynch analyst Heather Murren said.
In addition, investors fleeing volatile tech stocks have returned to the relative safety of traditional companies such as P&G, particularly since people tend to buy the same amount of toothpaste, diapers and other personal products regardless of the state of the economy and the markets.
Check other manufacturing stocks
"This is a group, which for the last couple of years had trouble meeting even revised expectations, and also revised expectations for cost containment," Murren said. "We upgraded the entire group keeping in mind that at some point people start to look for some arguably predictable defensive names when the economy slows. But the key issue is that they're able to expand the margins in light of a difficult operating environment."
The better-than-expected quarter follows a lackluster first quarter ended in September, when P&G reported flat earnings from the year-earlier period that were in line with Wall Street's expectations.
The company then blamed rising commodity prices and unfavorable currency exchange rates.
Those same factors affected the second quarter, but were offset by the company's cost-cutting measures, which helped improve margins, Murren said.
During the December quarter, P&G reported strong growth in several areas, including its health care segment, which saw earnings grow 31 percent to $164 million in the quarter. The company cited strict cost controls along with growth in its North America pharmaceuticals, oral care products and Iams, the No. 1 pet food line.
The company's largest segment, fabric and home care, showed some improvement in spite of continued stiff competition for its Swiffer mops, and Febreze and Dryel cleaning products. The division also suffered an inventory buildup following price increases in its laundry products.
Food and beverage earnings fell 9 percent to $124 million as sales fell 11 percent.
In December, P&G said it remained comfortable that it would fall within range of second-quarter estimates. 
|
|
|
|
|
 |

|