|
Wall St. seeks rebound
|
 |
March 13, 2001: 8:25 a.m. ET
Some recovery seen after big selloff; February retail sales data due
|
NEW YORK (CNNfn) - Battered U.S. stock markets look set to rebound Tuesday after Monday's big selloff but it remains to be seen if the gains can be sustained.
The Nasdaq-100 futures rose after fair value was calculated, indicating a �higher opening for the Nasdaq market. The Nasdaq composite index starts a session below 2,000 for the first time since December 1998.
Standard & Poor's futures rose modestly, pointing to a higher start for the S&P 500 and Dow Jones industrial average. The Dow begins the day at its lowest level since last October.
A steady stream of warnings about corporate sales and profits, job cuts and other signs of weakness led to Monday's drop on Wall Street, which accelerated in the final hour of trading. The Dow suffered its fifth-largest one-day point loss, with all 30 issues closing lower.
An economic report that could affect the markets Tuesday is the government's retail sales data for February. Economists surveyed by Briefing.com forecast that sales rose 0.3 percent, compared with a 0.7 percent increase in January. Excluding autos, sales are expected to have risen 0.1 percent after a 0.8 percent increase.
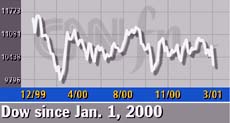 The Nasdaq composite index stands at 1,923.38 after Monday's drop of 6.3 percent. The Dow industrial average begins at its lowest point since Oct. 19 -- 10,208.25 -- after a 4.1 percent drop. The S&P 500 is at 1,180.16 after Monday's 4.3� percent decline. The Nasdaq composite index stands at 1,923.38 after Monday's drop of 6.3 percent. The Dow industrial average begins at its lowest point since Oct. 19 -- 10,208.25 -- after a 4.1 percent drop. The S&P 500 is at 1,180.16 after Monday's 4.3� percent decline.
Monday's Wall Street malaise spread around the world. Asian markets fell sharply Tuesday, with Tokyo's Nikkei index finishing at a 16-year low. European stocks started their day with significant losses.
Treasury prices were mixed early Tuesday. The 10-year note yield slipped to 4.91 percent from 4.92 percent late Monday, while the 30-year bond yield rose to 5.32 percent from 5.31 percent. The dollar retreated below 120 yen but gained against the euro. Brent oil futures dipped 16 cents to $26.25 a barrel in London.
 Kmart (KM: Research, Estimates) reported fiscal fourth-quarter earnings of 48 cents a share, a penny ahead of Wall Street forecast but down from 77 cents a year earlier. Kmart closed Monday at $9.15, down 45 cents. Kmart (KM: Research, Estimates) reported fiscal fourth-quarter earnings of 48 cents a share, a penny ahead of Wall Street forecast but down from 77 cents a year earlier. Kmart closed Monday at $9.15, down 45 cents.
Among companies slated to post results after the closing bell was CMGI (CMGI: Research, Estimates), the Internet developer whose recent performance is symbolic of the one-year thumping suffered by once high-flying tech issues. The company is expected to report a fiscal second-quarter loss of $2.27 a share, compared with the 77-cent-a-share loss a year earlier. CMGI shares closed Monday at $3.84, down 25 cents; their 52-week high is $151.50.
Tyco International Ltd., a diversified manufacturing and service company, announced plans Tuesday to acquire financial services company CIT Group Inc. for $9.2 billion in stock. Tyco (TYC: Research, Estimates) shares closed at $50.70, down $2.73 Monday. CIT Group shares �(CIT: Research, Estimates) closed down $1.18 at $22.75.
Germany's EM.TV & Merchandising is considering the sale of the Jim Henson Co., creator of the Muppets, barely a year after acquiring the firm, according to one person familiar with the situation. The top candidates to buy Henson are the Walt Disney Co. �(DIS: Research, Estimates) and Viacom Inc., �(VIA: Research, Estimates) according to a report in a German newspaper.
Albertson's, the No. 2 supermarket chain in the country, reported fourth-quarter net earnings of $220 million, or 54 cents a share after the bell Monday, down from $264 million, or 62 cents a share a year earlier, but higher than Wall Street estimates. Shares of Albertson's (ABS: Research, Estimates) lost $1.04 to $27.66 Monday. 
|
|
|
|
|
 |

|