|
U.S. prices barely higher
|
 |
March 16, 2001: 10:19 a.m. ET
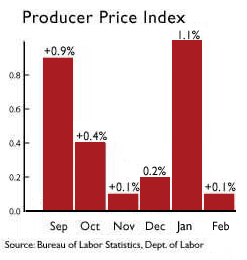
Wholesale prices edged up 0.1% in February; industrial output down 0.6%
|
NEW YORK (CNNfn) - Wholesale prices rose just 0.1 percent in the United States in February, in line with Wall Street forecasts, while industrial production came in weaker than expected. Analysts believe that Friday's government reports all but assure a rate cut by the Federal Reserve next Tuesday.
Excluding often volatile food and energy prices, the "core" producer price index of what it actually costs manufacturers to produce goods, fell 0.3 percent, which was below economists' forecasts.
Industrial production at U.S. factories fell 0.6 percent in February, the Federal Reserve said -- reflecting the impact of the slowing economy on the manufacturing sector, in which layoffs have been growing due to flagging demand. Though weaker than Wall Street forecasts for a 0.2 percent decline, production still came in 1.2 percent above year-earlier levels. January industrial production was revised downward.
 Factories, utilities and mines ran at just 79.4 percent of capacity, the lowest in nine years. Factories, utilities and mines ran at just 79.4 percent of capacity, the lowest in nine years.
Separately, housing starts edged down to a 1.65 million annual rate in February, a bit above forecasts. The housing market still is holding up despite the economic slowdown, indicating consumers are not panicking at the reality of an economic downturn.
Also Friday, the University of Michigan's twice-monthly barometer of consumer confidence came in at 91.8 for March, slightly higher than expected and better than the 90.6 level reported in February.
The Federal Reserve, which closely watches consumer confidence, meets next Tuesday. The central bank's policy makers are expected to cut interest rates for the third time this year in a bid to prevent the slowing economy from slipping into recession.
The Fed cut rates twice in January by a half-percentage point each time, and many economists have predicted a further half-point cut next week.
Regarding the possible size of a cut, "Fifty basis points (half a percentage point) is a certainty. Seventy-five (three quarters of a point) still looks like too much, given the circumstances," Pierre Ellis, senior economist at Decision Economics, told Reuters news service.
On Wall Street, stocks fell again as investors worried about the effect of a slowing economy on corporate profits. At noon. ET, the Dow Jones industrial average fell about 73 points to 9,959 while the Nasdaq composite index sank 21 to 1,920. Earlier the Nasdaq reached as low as 1,885, the first time the indicator has been below 1,900 since November 1998.
"The Fed ought to like it [the producer price report], and personally I'm breathing a huge sigh of relief," Maureen Allyn, chief economist at Zurich Scudder Investments, told CNNfn's Before Hours Friday.
Declining prices for passenger cars and light trucks drove the decrease in the core rate from a 0.7 percent advance in January. Passenger cars posted their largest price decline since July 1997.
Fuel prices rose 1.4 percent, far less than the 3.8 percent rise reported in January. That retreat was led by residential natural gas prices.
-- from staff and wire reports 
|
|
|
|
|
 |

|

