|
Midyear fund scorecard
|
 |
June 7, 2001: 7:23 a.m. ET
Small value funds top the list, while large growth funds lag
By Staff Writer Martine Costello
|
NEW YORK (CNNfn) - The little guy is wooing the hearts of investors on Wall Street in the first six months of the year.
On the heels of one of the worst market years in recent memory, small-cap value funds were top performers year to date as of June 1, while large growth and technology funds bottomed out the list, according to Chicago fund-tracker Morningstar.
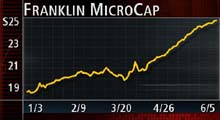
"It hasn't been a full recovery but it's been a good recovery in small value," said Bill Lippman, president of Franklin MicroCap Value Fund, which is up 33 percent this year.
|
|
|
Small cap value funds were top performers in 2001. | |
The mutual fund landscape is continuing on the new path it started in 2000, when small stocks and bonds were among the few bright spots.
The Nasdaq composite index plummeted 39.3 percent in 2000 and suffered its worst losses in its 30-year history, while the Dow Jones industrial average sank 6.2 percent, its first down year in a decade. Five interest-rate cuts in 2001 eased fears about the economy and breathed new life into some areas of the market.
"When you think back in the last couple of years, there have been so many unexpected twists and turns in the market," said Scott Cooley, an analyst at Morningstar. "It really makes sense to stay diversified."
The winners in 2001
At the top of the list, small value funds earned an average of 11.15 percent year to date as of June 1, second only to quirky precious metals funds, which earned 13.50 percent, according to Morningstar.
Small blend funds, which invest in growth and value stocks, were next on the list with gains of 6.36 percent.
"Small caps do better in recovery than large caps," said Tom Grzymala, a certified financial planner from Alexandria, Va. "A small company can move where the action is faster than the bigger guys."
Franklin MicroCap Value, with $200 million in assets, looks for stocks that are selling below book value. It invests in stocks with a market capitalization below $200 million, or an average of about $90 million in size.
"We buy things that are extraordinarily cheap," Lippman said.
One holding includes Garan Inc. (GAN: up $0.30 to $30.00, Research, Estimates), maker of the Garanimals children's clothing, Lippman said. The company has strong management and a well-known brand. The fund bought the stock for $16 a share and it's now trading around $30 a share.
Another holding is Penn-America Group (PNG: Research, Estimates), which sells insurance policies to local merchants in small towns.
"It's the kind of business Chubb or Aetna won't touch," Lippman said about Penn-America.
Natural resources funds are also enjoying good returns thanks to high oil prices and a wave of takeover activity. The category earned 5.83 percent in the first six months of 2001, Morningstar said.
And real estate funds are having their day in the sun, up 2.52 percent in the same time.
"They're doing well because they don't correlate to the stock market," Grzymala said about real estate funds.
And of course anything having to do with bonds have been having a great time in 2001, the figures show.
Short-term bond funds are up 3.55 percent, while long-term bond funds gained 3.20 percent.
One of the big turnaround stories of 2001 is that high-yield funds are reviving, up 3.91 percent this year, Morningstar said.
"This year, with the Fed cutting rates, people are getting bullish on the prospects of these companies making their debt payments," Cooley said.
The losers in 2001
Another big difference in 2001 is that biotechs aren't leading the pack anymore, Cooley said.�
Financials, health care and technology, the three main drivers of the economy, are also lackluster.
"You can't look at any one of those and say they're having a great year," Cooley said.
Technology funds were the worst performers of any category, down 25.23 percent this year, Morningstar said. Financial funds edged up 0.12 percent in the first six months, while health-care funds lost 12.47 percent.
Still, some stocks, like Microsoft (MSFT: up $0.80 to $73.16, Research, Estimates) and Dell Computer (DELL: up $0.21 to $25.47, Research, Estimates), are performing better this year, Cooley said.
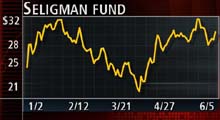
Among the few winners in technology funds is Seligman Communications & Information, up nearly 18 percent. The fund likes more value-oriented stocks, Cooley said. One holding in the Seligman fund, Clear Channel Communications, is up 30 percent, while another, Symantic, is up more than 100 percent, Morningstar said.
Grzymala said investors shouldn't sell their tech funds just because they are down. But they should look at what their fund owns.
"Technology is coming back," Grzymala said. Companies that sell to consumer � like Microsoft and Dell � will come back more quickly, thanks in part to the fed rate cuts and a tax refund coming in July.
|
|
|
A few tech funds are bucking the losing trend. | |
Some Internet funds are down as much as 25 percent this year, but others are doing better than tech funds. Cooley said it's because some Net funds are looking beyond pure Internet companies.
One fund that's bucking the trend, Kinetics Emerging Growth Fund, looks for "truly undiscovered companies" that use the Internet to enhance their business, said manager Steven Tuen. The fund, with about $5 million in assets, is up 7.59 percent as of June 1, Morningstar said.
Among the top holdings in the Kinetics fund are Actrade Financial (ACRT: down $0.11 to $39.89, Research, Estimates) , which has a patent on an online payment system, and Micro General Corp. (MGEN: up $0.21 to $14.21, Research, Estimates) , a financial company that provides IT services for the real estate business.
"For the most part, I think it's going to be difficult (for Internet funds) because they are all focusing on the same names like Cisco and Sun," Tuen said.
Other categories at the bottom of the list are communications funds, which include beleaguered telecom companies, down 18.46 percent, and Europe stock funds, down 14.43 percent, according to Morningstar data.
Large growth is off an average of 13.42 percent, while large value are up just 1.66 percent and large blend funds, which invest in both, are down 5.76 percent. That's left many of the 10 largest mutual funds, which dominate the 401(k) market, struggling.
Out of the top 10 funds, 7 out of 10 are in negative territory this year. The biggest loser is Fidelity Contrafund, down 7.58 percent, and Janus, off 7.39 percent.� Both are large growth funds.
Lippman, of the Franklin fund, remembers too well what life at the bottom is like.
During the roaring bull market years, value funds were horribly out of favor. Small value funds fared even worse.
Click here to check your mutual funds on CNNfn.com
"Value went through its own bear market, and it was particularly painful when everything else was going so great," Lippman said.
Lippman recalled being at cocktail parties where people would joke about how he must be living the good life since the market was so good. They didn't realize part of the market � small value � was in a funk.
"I would sneak off into a corner and hide," Lippman joked. "Now I'm the temporary hero. I don't have to hide."
But joking aside, Lippman said investors shouldn't be lulled by the latest performance charts. The answer is to have both growth and value in your lineup.
"People buy the latest hot item," Lippman said. "What they should be doing is buying the latest cold item." 
* Disclaimer
|
|
|
|
|
 |

|