graphic
News > Companies
Krispy Kreme profit up
August 23, 2001: 6:50 a.m. ET

Doughnut maker beats 2Q estimates by a penny, raises full-year guidance
graphic
graphic graphic
graphic
NEW YORK (CNNfn) - Krispy Kreme Doughnuts Inc. reported higher fiscal second-quarter earnings Thursday that were a penny a share ahead of Wall Street expectations, and raised its guidance on fiscal 2002 results.

For quarter ended July 29, Winston-Salem, N.C.-based Krispy Kreme (KKD: Research, Estimates) posted net income of $5.9 million, or 10 cents a share, up from $3.6 million, or 6 cents a share, a year earlier. Analysts on average forecast a profit of 9 cents a share, according to earnings tracker First Call.

The company also raised its guidance for fiscal 2002 to 42 cents a share from Wall Street's forecast of 40 cents a share and fiscal 2003 guidance to 59 cents a share from forecasts of 51 cents a share.

graphic  
Krispy Kreme also said it anticipates earnings per share to grow 30-35 percent a year for the next three years, higher than its previous guidance for 25 percent growth.

Revenue increased to $90 million from $70 million.

"I believe the strength of our brand, unique business model and a proven strategy positions us to achieve continued strong results over the long term," CEO Scott Livengood said.

The company said it plans to open 40 new stores in fiscal 2002, two more than it previously announced.

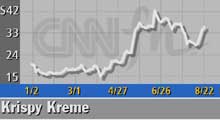
Krispy Kreme shares finished 17 cents lower at $34.98 Wednesday. graphic

  RELATED STORIES

Favorite Stock: Krispy Kreme Doughnuts - June 12, 2001

Krispy Kreme beats 1Q estimates - May 16, 2001

  RELATED SITES

Krispy Kreme


Note: Pages will open in a new browser window
External sites are not endorsed by CNNmoney


graphic


Most stock quote data provided by BATS. Market indices are shown in real time, except for the DJIA, which is delayed by two minutes. All times are ET. Disclaimer. Morningstar: © 2018 Morningstar, Inc. All Rights Reserved. Factset: FactSet Research Systems Inc. 2018. All rights reserved. Chicago Mercantile Association: Certain market data is the property of Chicago Mercantile Exchange Inc. and its licensors. All rights reserved. Dow Jones: The Dow Jones branded indices are proprietary to and are calculated, distributed and marketed by DJI Opco, a subsidiary of S&P Dow Jones Indices LLC and have been licensed for use to S&P Opco, LLC and CNN. Standard & Poor's and S&P are registered trademarks of Standard & Poor's Financial Services LLC and Dow Jones is a registered trademark of Dow Jones Trademark Holdings LLC. All content of the Dow Jones branded indices © S&P Dow Jones Indices LLC 2018 and/or its affiliates.

Most stock quote data provided by BATS. Market indices are shown in real time, except for the DJIA, which is delayed by two minutes. All times are ET. Disclaimer. Morningstar: © 2018 Morningstar, Inc. All Rights Reserved. Factset: FactSet Research Systems Inc. 2018. All rights reserved. Chicago Mercantile Association: Certain market data is the property of Chicago Mercantile Exchange Inc. and its licensors. All rights reserved. Dow Jones: The Dow Jones branded indices are proprietary to and are calculated, distributed and marketed by DJI Opco, a subsidiary of S&P Dow Jones Indices LLC and have been licensed for use to S&P Opco, LLC and CNN. Standard & Poor's and S&P are registered trademarks of Standard & Poor's Financial Services LLC and Dow Jones is a registered trademark of Dow Jones Trademark Holdings LLC. All content of the Dow Jones branded indices © S&P Dow Jones Indices LLC 2018 and/or its affiliates.