graphic
News > Companies
Williams-Sonoma beats 2Q
August 24, 2001: 8:45 a.m. ET

Earnings slide on higher sales but top forecast; company warns on 3Q
graphic
graphic graphic
graphic
NEW YORK (CNNfn) - Home products retailer Williams-Sonoma Inc. posted sharply lower fiscal second-quarter earnings Friday but topped Wall Street expectations as the company logged higher sales at its Williams-Sonoma, Outlet and Pottery Barn stores

The company also warned that third-quarter results likely will fall short of estimates and said it anticipates full-year profit at the low end of expectations.

For the quarter ended July 29, San Francisco-based Williams-Sonoma earned $1.4 million, or 2 cents a share, down from $5.1 million, or 9 cents a share, a year earlier. Analysts on average expected a break-even quarter, according to earnings tracker First Call.

Revenue grew 17.1 percent to $429 million from $366.5 million.

graphic  
The company said it now anticipates third-quarter earnings between 5 cents and 7 cents a share, below analysts' forecasts of 10 cents a share, according to First Call. Revenue is expected to be $478 million and $492 million..

Williams-Sonoma also expects full-year earnings of $1.17 to $1.24 a share compared with expectations of $1.20 a share. It sees full-year revenue of about $2.1 billion.

Sales at stores open at least a year, a key gauge known as same-store sales, increased 1 percent in the second quarter versus a 7 percent increase a year earlier.

Click here for retail stocks

The company posted lower gross margins in the quarter due mainly to higher expenses.

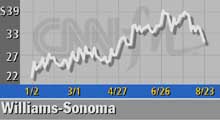
Williams-Sonoma (WSM: Research, Estimates)  shares slid $2.30 to finish at $28.60 Thursday. graphic

  RELATED STORIES

Williams-Sonoma taps Venator CEO - Feb. 12, 2001

  RELATED SITES

Williams-Sonoma


Note: Pages will open in a new browser window
External sites are not endorsed by CNNmoney


graphic


Most stock quote data provided by BATS. Market indices are shown in real time, except for the DJIA, which is delayed by two minutes. All times are ET. Disclaimer. Morningstar: © 2018 Morningstar, Inc. All Rights Reserved. Factset: FactSet Research Systems Inc. 2018. All rights reserved. Chicago Mercantile Association: Certain market data is the property of Chicago Mercantile Exchange Inc. and its licensors. All rights reserved. Dow Jones: The Dow Jones branded indices are proprietary to and are calculated, distributed and marketed by DJI Opco, a subsidiary of S&P Dow Jones Indices LLC and have been licensed for use to S&P Opco, LLC and CNN. Standard & Poor's and S&P are registered trademarks of Standard & Poor's Financial Services LLC and Dow Jones is a registered trademark of Dow Jones Trademark Holdings LLC. All content of the Dow Jones branded indices © S&P Dow Jones Indices LLC 2018 and/or its affiliates.

Most stock quote data provided by BATS. Market indices are shown in real time, except for the DJIA, which is delayed by two minutes. All times are ET. Disclaimer. Morningstar: © 2018 Morningstar, Inc. All Rights Reserved. Factset: FactSet Research Systems Inc. 2018. All rights reserved. Chicago Mercantile Association: Certain market data is the property of Chicago Mercantile Exchange Inc. and its licensors. All rights reserved. Dow Jones: The Dow Jones branded indices are proprietary to and are calculated, distributed and marketed by DJI Opco, a subsidiary of S&P Dow Jones Indices LLC and have been licensed for use to S&P Opco, LLC and CNN. Standard & Poor's and S&P are registered trademarks of Standard & Poor's Financial Services LLC and Dow Jones is a registered trademark of Dow Jones Trademark Holdings LLC. All content of the Dow Jones branded indices © S&P Dow Jones Indices LLC 2018 and/or its affiliates.