|
Big Three August sales fall
|
 |
September 4, 2001: 2:26 p.m. ET
Ford decline less than expected; Chrysler nearly passed by Toyota
|
NEW YORK (CNNfn) - Domestic automakers continued to lose ground to imports in August sales, although No. 2 Ford Motor Co. saw a smaller decline in U.S. than company executives forecasted last month.
General Motors Corp. (GM: down $0.77 to $53.83, Research, Estimates) reported a 7.6 percent decline in U.S. sales of cars and light trucks in August to 403,258 light vehicles.
That's slightly worse than the 6.8 percent fall in sales it saw during the first seven months of the year. GM's U.S. light truck sales climbed 7.1 percent for the month, but a 19.7 percent decline in car sales left it in negative territory.
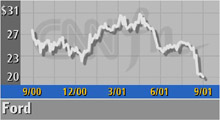
Ford Motor Co. (F: down $0.26 to $19.99, Research, Estimates) reported U.S. sales fell 7.5 percent to 325,943 in the month from the record August sales it reported in the year-earlier period. Last month, when the company lowered its earnings guidance for the rest of the year and announced a plan to cut up to 10 percent of North American management, Martin Inglis, the company's chief financial officer, warned analysts it was looking at a 10-to-15 percent decline from year-earlier sales.
"August is better than expected, and I think it's a month we can build on," said George Pipas, manager of sales analysis for Ford. "In fact our results are better than they look at first glance."
German automaker DaimlerChrysler's North American Chrysler unit reported a 24 percent decline in U.S. sales to 164,555 from 216,869 in the year-earlier period. The drop put the third member of the traditional Big Three U.S. automakers in danger of being passed by Toyota Motor Co. in terms of U.S. sales.
Toyota reported U.S. sales of 158,918 vehicles for its Toyota and Lexus brands, up 7 percent from its year-earlier sales, and less than 3 percent below Chrysler's sales total.
The gain by Toyota was also seen by other major importers, as Japanese competitor Honda, German automaker Volkswagen and Korean automaker Hyundai all reported gains in sales in the month. The traditional Big Three still account for 59.8 percent of U.S. sales in August, according to Autodata, a tracker of auto sales, but that's down from a combined 63.6 percent of sales in August of 2000, with almost all that decline attributed to Chrysler's slide.
Pipas said Ford was pleased that the drop in market share was only a half of a percentage point in August, compared with the nearly 2 percentage point decline year-to-date. He pointed out that fleet sales, which represents large block sales to businesses, is off 21 percent from August of 2000, suggesting that consumer spending on vehicles is staying relatively strong. And he said that while Inglis' mid-August estimate was based on incomplete data available at that time, that sales seemed to build in the second half of the month.
Ford showed relatively strong sales of its pick-up trucks and sport/utility vehicles, with both posting gains.
The F-series pickup truck saw sales rise 5.4 percent to 75,038 in the month, overcoming a decline in sales in the compact pickup segment. And while the best selling SUV, the Explorer, and most other SUV models saw sales slip from year-earlier results, the introduction of the Escape, a compact SUV, allowed the segment as a whole to post a 2.4 percent gain from year-earlier sales.
But Ford saw passenger car sales fall 16.3 percent to 119,960, while minivan sales plunged 30 percent.
Click here for a look at automotive stocks
The company said it would stick with lowered production levels of 930,000 vehicles in the third quarter and 980,000 in the fourth quarter. 
|
|
|
|
|
 |

|