graphic
graphic  
graphic
News > Companies
graphic
Gannett's 3Q earnings fall
graphic October 15, 2001: 10:44 a.m. ET

Yet the media group's results edge past Wall Street's lowered forecasts.
graphic
graphic graphic
graphic
graphic
graphic       graphic
  • Gannett 3Q could fall as much as 20% - Sept. 21, 2001
  •  
    graphic
    graphic
    graphic       graphic
  • Gannett
  •  
    graphic
    NEW YORK (CNNmoney) - Newspaper publisher Gannett reported third-quarter earnings Monday that were lower than the year-earlier quarter and hurt by the Sept. 11 terror attacks, but it managed to surpass Wall Street's lowered expectations.

    Gannett, which publishes USA Today and 97 other papers, reported earnings in the quarter ended Sept. 30 of $175 million, or 66 cents a share, compared with $208 million, or 79 cents a share, a year ago. Wall Street analysts expected Gannett to earn 64 cents a share, according to earnings tracker First Call.

    Before Sept. 11, Wall Street expected Gannett, which also has television and Internet businesses, to earn 73 cents a share. But the company warned on Sept. 21 that the attacks on New York and Washington had cut into advertising demand that already had been weakened by a slowing U.S. economy.

    graphic  
    "The events of Sept. 11 once again confirmed the importance of our business: news and information are crucial to the well-being of our readers and viewers and the communities we serve," CEO Douglas H. McCorkindale said. "But these same events accelerated declines in an already-challenging domestic advertising environment."

    Third-quarter revenue fell to $1.5 billion from $1.6 billion a year ago.

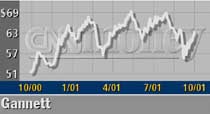
    Gannett (GCI: down $0.20 to $63.00, Research, Estimates) shares rose in early trading Monday. graphic

      RELATED STORIES

    Gannett 3Q could fall as much as 20% - Sept. 21, 2001

      RELATED LINKS

    Gannett


    graphic graphic


    Most stock quote data provided by BATS. Market indices are shown in real time, except for the DJIA, which is delayed by two minutes. All times are ET. Disclaimer. Morningstar: © 2018 Morningstar, Inc. All Rights Reserved. Factset: FactSet Research Systems Inc. 2018. All rights reserved. Chicago Mercantile Association: Certain market data is the property of Chicago Mercantile Exchange Inc. and its licensors. All rights reserved. Dow Jones: The Dow Jones branded indices are proprietary to and are calculated, distributed and marketed by DJI Opco, a subsidiary of S&P Dow Jones Indices LLC and have been licensed for use to S&P Opco, LLC and CNN. Standard & Poor's and S&P are registered trademarks of Standard & Poor's Financial Services LLC and Dow Jones is a registered trademark of Dow Jones Trademark Holdings LLC. All content of the Dow Jones branded indices © S&P Dow Jones Indices LLC 2018 and/or its affiliates.

    Most stock quote data provided by BATS. Market indices are shown in real time, except for the DJIA, which is delayed by two minutes. All times are ET. Disclaimer. Morningstar: © 2018 Morningstar, Inc. All Rights Reserved. Factset: FactSet Research Systems Inc. 2018. All rights reserved. Chicago Mercantile Association: Certain market data is the property of Chicago Mercantile Exchange Inc. and its licensors. All rights reserved. Dow Jones: The Dow Jones branded indices are proprietary to and are calculated, distributed and marketed by DJI Opco, a subsidiary of S&P Dow Jones Indices LLC and have been licensed for use to S&P Opco, LLC and CNN. Standard & Poor's and S&P are registered trademarks of Standard & Poor's Financial Services LLC and Dow Jones is a registered trademark of Dow Jones Trademark Holdings LLC. All content of the Dow Jones branded indices © S&P Dow Jones Indices LLC 2018 and/or its affiliates.

    graphic