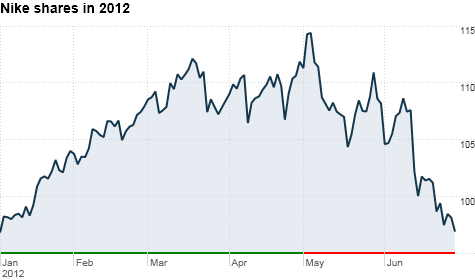
Click the chart for more info on Nike shares.
NEW YORK (CNNMoney) -- Nike shares plunged 13% in after-hours trading Thursday following a quarterly earnings report that missed analyst estimates.
The sportswear giant's quarterly revenue rose 12% versus last year to $6.5 billion, but net income fell 8% on declining margin and increased expenses.
In particular, Nike cited factors including rising materials costs, a higher effective tax rate and increased marketing expenses surrounding events like the Summer Olympics and soccer's European Championship.
The company also took a $24 million charge related to its restructuring in Western Europe, and incurred a stiff customs fee in an unnamed emerging market country based on its imports in previous years.
Nike's (NKE, Fortune 500) earnings per share were $1.17; analysts surveyed by Thomson Reuters had expected them to hit $1.37.
Nike announced plans last month to divest its Cole Haan and Umbro businesses. Those two units lost a combined $43 million during Nike's 2012 fiscal year, which concluded at the end of May.
Other sportswear producers and retailers also slumped after-hours on the news. Under Armor (UA) dropped 3.9%, Dick's Sporting Goods (DKS, Fortune 500) slipped 1.0%, and Lululemon Athletica (LULU) fell 2.6%. ![]()
| Index | Last | Change | % Change |
|---|---|---|---|
| Dow | 32,627.97 | -234.33 | -0.71% |
| Nasdaq | 13,215.24 | 99.07 | 0.76% |
| S&P 500 | 3,913.10 | -2.36 | -0.06% |
| Treasuries | 1.73 | 0.00 | 0.12% |
| Company | Price | Change | % Change |
|---|---|---|---|
| Ford Motor Co | 8.29 | 0.05 | 0.61% |
| Advanced Micro Devic... | 54.59 | 0.70 | 1.30% |
| Cisco Systems Inc | 47.49 | -2.44 | -4.89% |
| General Electric Co | 13.00 | -0.16 | -1.22% |
| Kraft Heinz Co | 27.84 | -2.20 | -7.32% |
| Overnight Avg Rate | Latest | Change | Last Week |
|---|---|---|---|
| 30 yr fixed | 3.80% | 3.88% | |
| 15 yr fixed | 3.20% | 3.23% | |
| 5/1 ARM | 3.84% | 3.88% | |
| 30 yr refi | 3.82% | 3.93% | |
| 15 yr refi | 3.20% | 3.23% |
Today's featured rates:


