|
J.C. Penney sales down
|
 |
March 1, 2001: 9:14 a.m. ET
Struggling retailer reports decline in February sales as it restructures
|
NEW YORK (CNNfn) - Struggling retailer J.C. Penney said Thursday February sales fell 2.1 percent at stores open at least a year. The results reflect a slowing economy and a company-wide restructuring aimed at shoring up the chain's sagging profits.
Plano, Texas-based J.C. Penney (JCP: Research, Estimates), the nation's No. 5 retailer, said sales at stores open at least a year, a closely-watched figure known as same-store sales, fell 2.1 percent while total sales declined 0.8 percent to $2.314 million from $2.332 million in the year-ago period.
Same-store sales are widely scrutinized because they are thought to provide a more realistic snapshot of a retailer's sales performance.
 The sales report comes a week after Penney reported a smaller fourth-quarter loss than expected. It said at the time that it expects a restructuring program to boost results in 2001. The sales report comes a week after Penney reported a smaller fourth-quarter loss than expected. It said at the time that it expects a restructuring program to boost results in 2001.
The chain has been hurt in recent quarters by the slowing economy as well as more intense competition from rivals such as Kohl's Corp. �(KSS: Research, Estimates) and Target Corp. (TGT: Research, Estimates).
Penney's total department store sales declined 3.8 percent in February to $858 million from $892 million a year earlier.
Catalog sales dropped 10.7 percent, due mainly to the planned elimination of several sale and specialty catalogs, the company said. Internet sales, which are included with catalog sales, increased in the period.
Sales at Eckerd Corp., the drugstore chain the company owns, increased 5 percent to $1.1 billion in February from $1 billion a year earlier. Comparable drugstore sales increased 12 percent, driven mainly by pharmaceuticals.
Direct marketing sales decreased 3.1 percent in the period.
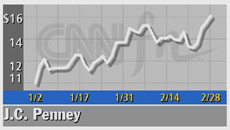
Shares of J.C. Penney gained 53 cents to $16.18 Wednesday. 
|
|
|
|
|
 |

|