|
Treasurys creep ahead
|
 |
March 22, 2001: 9:14 a.m. ET
Government debt prices expect continued stock weakness; dollar strong
|
NEW YORK (CNNfn) - U.S. Treasurys rose in early trade Thursday, but gains were tentative, as investors watched fluctuating stock futures for signals.
 Shortly after 9:00 a.m. ET, two-year Treasury notes were up 1/32 at 100-25/32, as their yield, which moves inversely to the price, was at 4.19 percent. Five-year notes were 2/32 higher at 105-14/32 to yield 4.44 percent. Shortly after 9:00 a.m. ET, two-year Treasury notes were up 1/32 at 100-25/32, as their yield, which moves inversely to the price, was at 4.19 percent. Five-year notes were 2/32 higher at 105-14/32 to yield 4.44 percent.
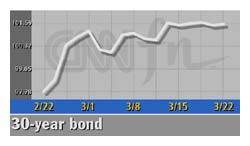
Benchmark 10-year notes were up 4/32 at 101-28/32, yielding 4.76 percent. And 30-year bonds were up 6/32 at 101-18/32, yielding 5.27 percent.
Bonds respond to stocks
The U.S. stock market's selloff picked up speed and depth this week after the Federal Reserve disappointed investors Tuesday with a smaller-than-hoped-for interest rate cut. The weakness infected other equity markets Thursday, as the main stock indexes in Asia and Europe tumbled.
In turn, the mood soured further in the U.S., with S&P futures trading down and blue-chip stocks expected to open lower, sending the Dow Jones industrial average into "bear" territory, defined as a drop of more than 20 percent.
But Nasdaq futures were up more than 20 points, leading to confusion about the direction equities would take during the day.
"The equity market will be the main driver of the day again," Mike Cloherty, market strategist at Credit Suisse First Boston, said.
U.S. Treasurys, especially shorter-dated debt, are considered low-risk investments because they are backed by the government of the world's biggest economy and therefore often become more attractive when other markets are losing ground.
Dollar adds to gains
The dollar rose across the board, sending the euro to three-month lows and hitting fresh 22-month highs against the yen. Traders attributed gains to safe haven flows to U.S. Treasurys.
 The dollar broke a strong resistance level at 124 yen in European trade to hit 22-month peaks of 124.19 yen, within one yen of the 1999 high of 124.79, according to Reuters data. The dollar broke a strong resistance level at 124 yen in European trade to hit 22-month peaks of 124.19 yen, within one yen of the 1999 high of 124.79, according to Reuters data.
The euro fell below 89 cents for the first time this year, hitting three-month lows of 88.69 cents. The dollar later edged off its highs against the yen and euro. 
- from staff and wire reports
|
|
|
|
|
 |

|